A sales dashboard for a Shopify store: what to measure and how to connect it
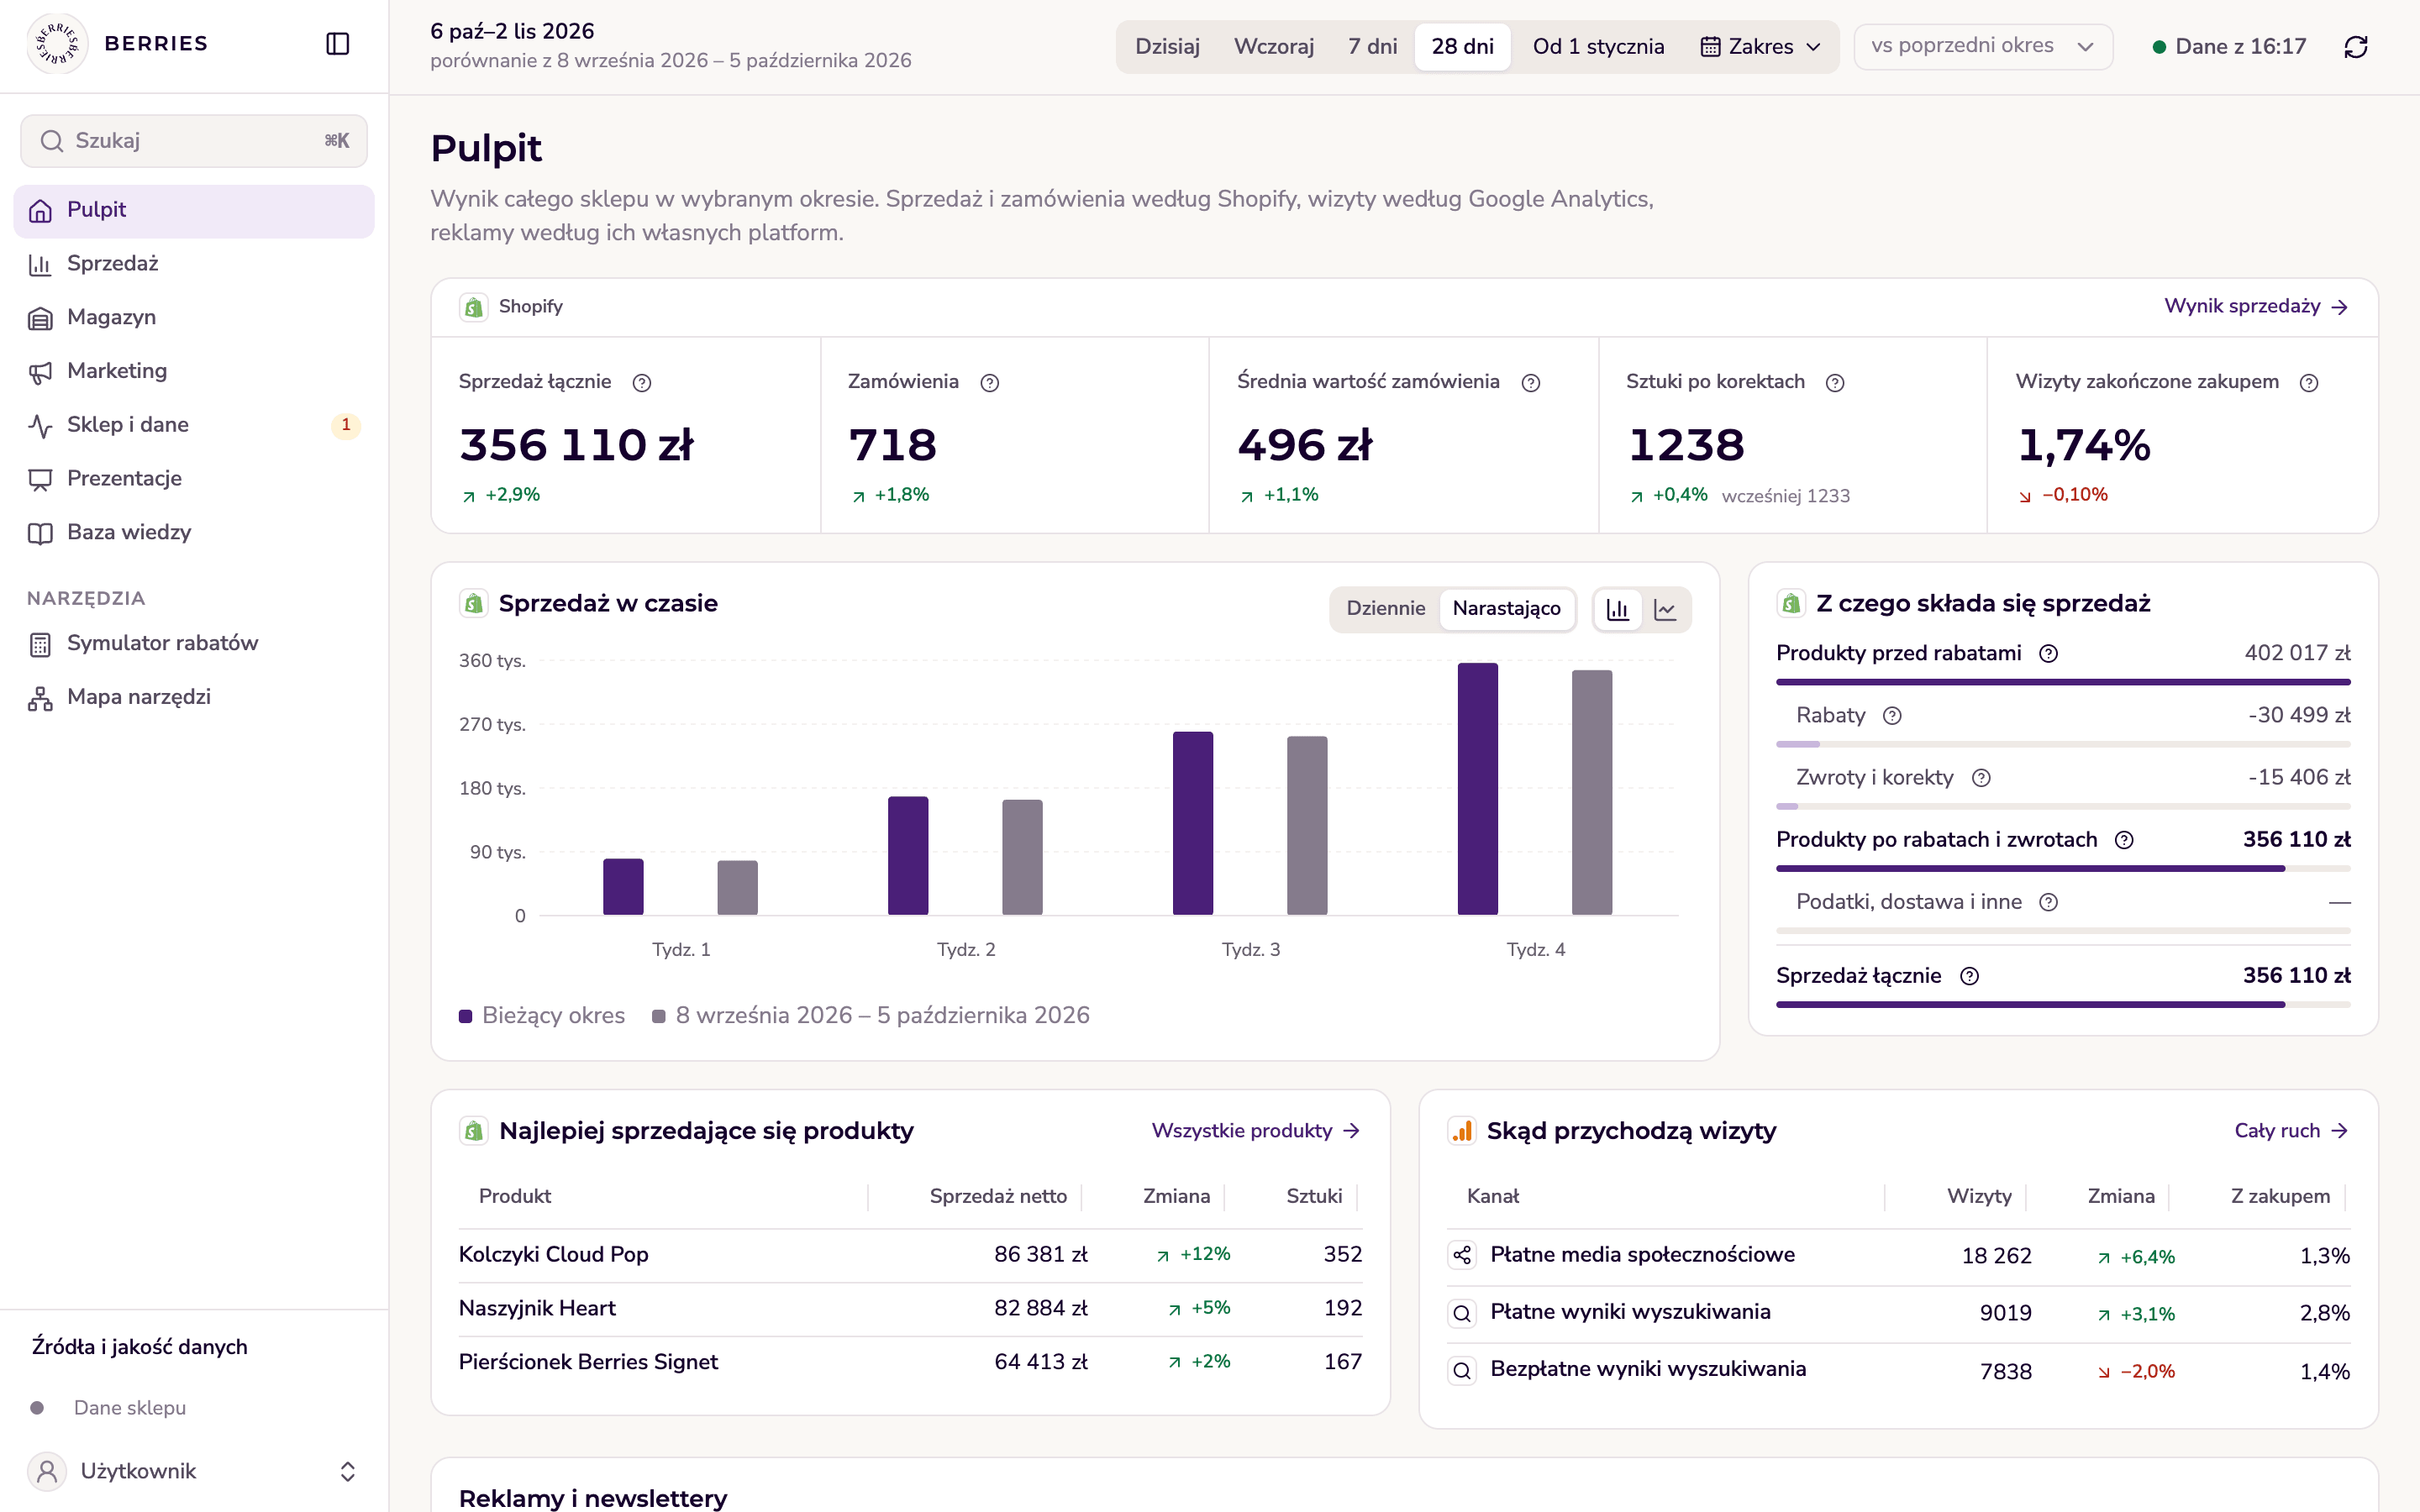
A good sales dashboard first answers a simple question: how are sales doing against the plan. For that to work, the numbers from Shopify, Google, Meta and Klaviyo have to be comparable. That’s how I built the dashboard for the team of Berries, a jewellery brand.

Why the numbers don’t match
At Berries, sales, ads, newsletters and stock lived in separate tools. Each one counted results its own way. A simple question about how sales were going meant looking in several places.
Shopify shows the store’s orders. Ad platforms and newsletter tools credit themselves with sales by their own rules. That’s why their totals usually add up to more than the store actually sold.
What the dashboard shows
- Sales together with the plan and a forecast for the whole year.
- Stock levels next to sales.
- Marketing: ads and newsletters counted so they can be compared with store sales.
- A discount simulator that shows a promotion’s effect on the result before it runs.
- A knowledge base with guides, so the team can change store content on its own.
How I build it, step by step
- I write down the questions the team asks every week and start the layout from them.
- I clean up measurement in the store and the marketing tools, so every number has a clear source.
- I agree with the team which tool is the reference for sales and which ones show each channel’s share.
- I add the plan for the whole year, so every result is seen against it.
- I set up access: everyone signs in with their Google account and sees the parts they’re allowed to see.
- I set up a daily sales summary in Slack, so nobody has to open the dashboard for one number.
- Bigger changes go to a test version first, and only then live.
What changes for the team
The Berries team checks results in one place, together with the plan for the whole year. Daily sales summaries arrive in Slack. I keep developing the dashboard along with the store.
In the project’s screenshots the dashboard shows made-up numbers, not Berries’ results.
What I need to start
- Access to Shopify and to the marketing tools the store uses.
- The sales plan, if the company has one.
- A list of questions the team wants answered.
- One person on the team who can make decisions quickly.